GIS and Mapping in Agriculture: How Spatial Intelligence Is Re-Shaping Modern Farming
Table of Contents
- What Is GIS? Quick Definition & Core Components
- Where GIS Adds Value in the Farming Value-Chain
- Eight Tangible Benefits Farmers Report From GIS Adoption
- Ten High-Impact Agricultural Applications of GIS
- 1 High-Resolution Soil Mapping
- 2 Variable-Rate Fertiliser & Seeding
- 3 GIS-Guided Irrigation Optimisation
- 4 Crop-Health & Stress Detection
- 5 Weed, Disease & Pest Risk Modelling
- 6 Yield Forecasting & Marketing Logistics
- 7 Climate-Risk & Disaster Mitigation
- 8 Livestock & Grazing Management
- 9 Soil-Carbon Monitoring & MRV for Carbon Markets
- 10 Regulatory Compliance & Sustainability Reporting
- Essential Hardware & Data Sources
- Choosing a GIS Software-Stack for Your Farm
- Farm-Level Case Studies (US, Brazil, India, Kenya)
- The Future of GIS: Five Trends to Watch to 2030
- FAQs
- Conclusion – A Spatial Mindset for Profitable, Sustainable Agriculture
What Is GIS? Quick Definition & Core Components
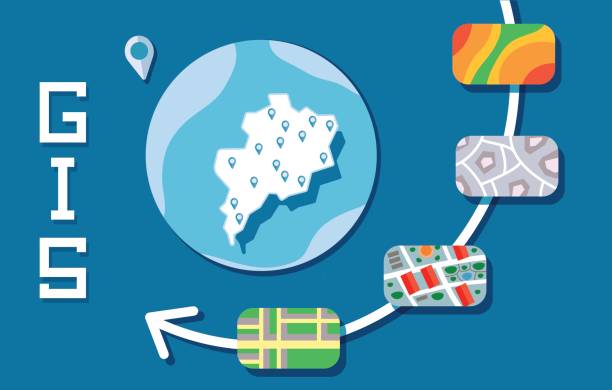
A Geographic Information System (GIS) is a framework—hardware, software, data and workflows—used to capture, store, analyse and visualise information that has a geographic or spatial component. Any datapoint that can be tied to a coordinate—whether a soil-nutrient reading, a combine-yield log or the collar position of a cow—can be layered inside a GIS.
The system typically comprises:
- Spatial data – vector layers (points, lines, polygons) and raster layers (imagery, elevation DEMs, NDVI grids).
- Attribute data – tables describing each feature (e.g., soil pH, crop variety, planting date).
- Hardware – GNSS-enabled tractors, RTK base stations, satellites, drones, IoT soil-moisture probes, rugged tablets.
- Software – desktop tools (ArcGIS Pro, QGIS), cloud platforms (AgLeader, Trimble Ag, Climate FieldView), mobile apps and web dashboards.
- People & processes – agronomists, GIS analysts, field scouts and farmers who convert maps to management actions.
Where GIS Adds Value in the Farming Value-Chain
Historically, a farm’s geographic knowledge lived inside the operator’s head: “the sandy knoll on the north corner dries out first” or “alfalfa lodges in the low draw.” GIS converts that implicit knowledge into explicit digital layers that can be queried, modelled and shared—enabling:
- Input optimisation – right rate, right place, right time for fertiliser, lime, seed and water.
- Risk reduction – early detection of stress zones, flood plains, frost pockets.
- Asset management – track fences, tile drains, irrigation laterals, beehive locations.
- Supply-chain transparency – prove origin, carbon footprint and sustainable practices to buyers.
- Decision automation – feed spatial layers into variable-rate controllers, autonomous tractors or sprayer drones.
Eight Tangible Benefits Farmers Report From GIS Adoption
- 5–25 % yield uplift through site-specific agronomy.
- 10–40 % saving on fertiliser, seed and chemicals.
- Up to 50 % water-use reduction via sensor-guided irrigation.
- Lower greenhouse-gas emissions per tonne of crop.
- Improved soil health by tracking organic matter and compaction zones.
- Faster scouting – hours of boot-worn field walks replaced by 10-minute drone flights.
- Compliance confidence – audit-ready nutrient-management plans, spray logs, carbon baselines.
- Higher land value – documented productivity maps boost buyer confidence.
Ten High-Impact Agricultural Applications of GIS
1 High-Resolution Soil Mapping
Combining legacy soil-survey polygons with on-the-go EC (electrical conductivity) sensors, gamma‐ray spectrometry and yield data, agronomists generate 5-metre resolution soil fertility maps. These layers drive zone sampling and variable-rate lime or gypsum, correcting pH differences of 0.8–1.2 units across a single field.
2 Variable-Rate Fertiliser & Seeding
GIS converts yield potential maps into shapefiles (.shp) or ISO-XML prescriptions. A 48-row planter linked to RTK GNSS can shift population from 30 000 to 38 000 seeds/acre on-the-fly—saving seed in low-yield sand ridges and boosting population in high-organic-matter flats.
3 GIS-Guided Irrigation Optimisation
Centre-pivot control software ingests NDVI and soil-moisture sensor rasters, producing variable-rate irrigation sectors. University trials in Nebraska showed 23 % water savings and 5 % maize yield bump over uniform application.
4 Crop-Health & Stress Detection
Multi-spectral drone imagery transformed into NDVI, NDRE and CWSI (Crop Water Stress Index) layers flags chlorosis or water stress two weeks before visible to the naked eye. Farmers intervene earlier with foliar feeds or targeted irrigation pulses.
5 Weed, Disease & Pest Risk Modelling
Layer habitat maps, wind roses and aphid flight models to predict sitka virus hotspots. Integrate with sprayer drones (DJI T50) to spot-treat only infected patches—cutting fungicide usage by 60 % and reducing runoff.
6 Yield Forecasting & Marketing Logistics
Machine-learning models train on five-year spatial yield history, weather forecasts and vegetation indices to predict harvest volumes by field and week. Co-ops use this data to schedule dryers and transport, trimming bottlenecks.
7 Climate-Risk & Disaster Mitigation
Overlay elevation DEMs, river buffers and rainfall intensity curves to delineate 10-, 25- and 100-year flood zones. Farmers adjust planting dates, shift spring wheat to higher ground and insure high-risk blocks accordingly.
8 Livestock & Grazing Management
GPS-ear-tag pings build heat maps of cattle grazing intensity. Combine with pasture NDVI to rotate herds before over-grazing occurs, boosting forage regrowth by 15 %.
9 Soil-Carbon Monitoring & MRV
Carbon credit programmes demand Measurement, Reporting & Verification (MRV). GIS stores geolocated soil-core labs, remote-sensing biomass estimates and management logs to document carbon sequestration and unlock $15–40 t⁻¹ payments.
10 Regulatory Compliance & Sustainability Reporting
EU Nitrates Directive, US FSMA, UAE organic standards—all require traceable records. GIS produces maps and reports for inspectors with a few clicks, avoiding costly penalties.
Essential Hardware & Data Sources
| Device / Source | Typical Resolution | Key Use |
|---|---|---|
| RTK GNSS tractor receiver | <2 cm | Precision auto-steer, VR prescriptions |
| Multispectral drone (DJI Phantom 4 MS) | 2–5 cm GSD | Crop stress detection |
| PlanetScope satellite | 3 m daily | Large-area NDVI monitoring |
| Soil moisture sensor (Sentek/Decagon) | Point | Irrigation scheduling |
| Yield monitor on combine | Every 3–5 m | Yield mapping, zone creation |
Choosing a GIS Software-Stack for Your Farm
Desktop GIS (ArcGIS Pro, QGIS) offers deep analysis but steeper learning. Cloud agronomy platforms (Trimble Ag, Climate FieldView, Xarvio) streamline imagery ingestion and prescription writing. Many farms run a hybrid: cloud for day-to-day scouting, desktop for advanced topology or watershed modelling.
Farm-Level Case Studies
1 US Corn/Soy Operation Boosts ROI $58 ha⁻¹
A 4 000-acre Iowa family farm integrated five years of soil EC, RTK yield maps and drone NDVI into AgLeader SMS. Variable-rate P & K cut fertiliser cost $26 ha⁻¹. Zone seeding added 0.4 t ha⁻¹ soy yield. Net ROI: $58 ha⁻¹ annually.
2 Brazilian Sugar-Cane Estate Cuts Water by 35 %
Installing 180 soil-moisture probes and Sentinel-2 imagery in QGIS guided variable-rate hose-reel irrigation. Water use dropped 35 %, electricity costs 22 %, while cane tonnage per hectare held steady.
3 Smallholder Rice Farmers in India Triple Net Profit
A cooperative shared a drone/GIS service: Mavic 3M flights every 10 days, mobile NDVI maps, ad-hoc nutrient recommendations. Timely zinc and urea foliar feeds lifted yields 18 % and reduced nitrogen by 28 %. Farmers’ net profit tripled due to lower input spend and premium grain quality.
4 Kenyan Horticulture Exporter Achieves GlobalGAP With GIS
To satisfy European buyers, a 200 ha French-bean producer documented spray buffers, river setbacks and worker re-entry intervals in ArcGIS Online, passing GlobalGAP audit and accessing 12 % higher contract price.
The Future of GIS: Five Trends to Watch to 2030
- Edge AI analytics – field-edge devices run NDVI classification in real time without cloud latency.
- Sub-inch satellite imagery – commercial very-high-resolution constellations bring drone-level detail daily.
- Digital twins of whole farms – 3-D mesh models integrating LiDAR, soil layers and IoT sensors for scenario planning.
- Blockchain traceability – GIS polygons link to supply-chain ledgers, proving field of origin and sustainability metrics.
- One-click prescriptions – AI converts multi-year datasets into ready-to-spray variable-rate files automatically.
Frequently Asked Questions
Is GIS only for large farms?
No. Open-source QGIS plus low-cost drone imagery make spatial analysis viable for 5-hectare vegetable operations.
How expensive is it to get started?
Entry level: free QGIS, $1 500 consumer drone, $250 RTK correction subscription. Larger operations may invest $10 000+ in software licences and sensors.
Can I integrate tractor data automatically?
Most modern machines export ISOXML or shapefiles. Tools like John Deere Operations Center or AgLeader AgFiniti sync wirelessly into GIS platforms.
Conclusion — A Spatial Mindset for Profitable, Sustainable Agriculture
Geography underpins every agronomic decision. By adopting a geospatial mindset and the practical tool-set of GIS and mapping, farmers unlock richer insights, higher profit margins and demonstrable sustainability credentials. Whether you start with a single NDVI drone map or a full-blown enterprise GIS, the destination is the same: better decisions, made faster, with data you can see.
Ready to explore more precision-ag tools? Dive into our guides on soil-texture analysis, smart irrigation options, and organic farming systems to complement your new GIS workflow.


Leave a Reply